Righ model, right tools - the new way of building and collaborating on frontend apps is the core element of Micro Frontends.

Righ model, right tools - the new way of building and collaborating on frontend apps is the core element of Micro Frontends.
Remove backgrounds 100% automatically in 5 seconds with one click. Thanks to remove.bg https://www.remove.bg/ clever AI.


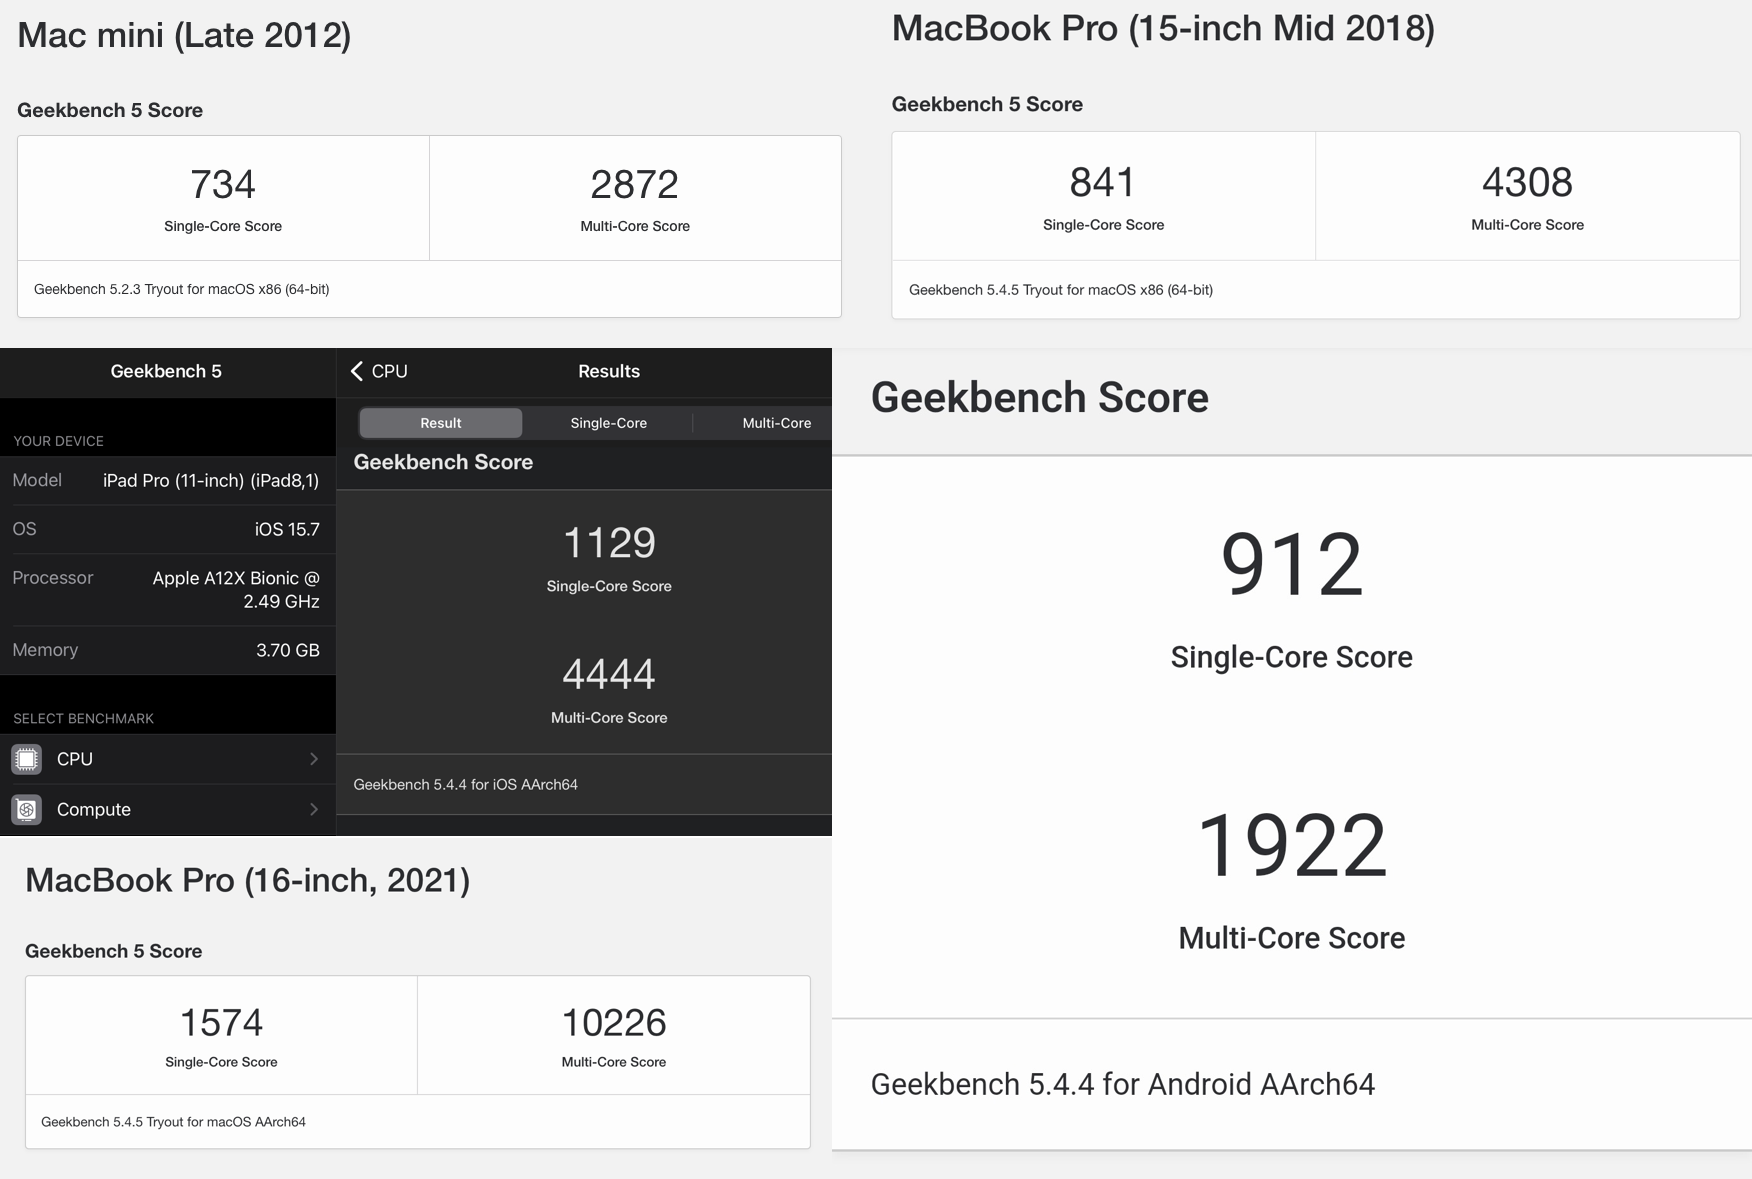
Geekbench head to head - Mac vs iPad vs Android:

Conclusion:
ARM vs x86 谁是未来,一目了然。
NOTE
The Apple M1 chip is built for Macs, and the A15 for phones. They use completely different architectures. The A15 prioritizes battery over performance. The M1 has more firepower for graphics.
Prerequisites:
Step by step:


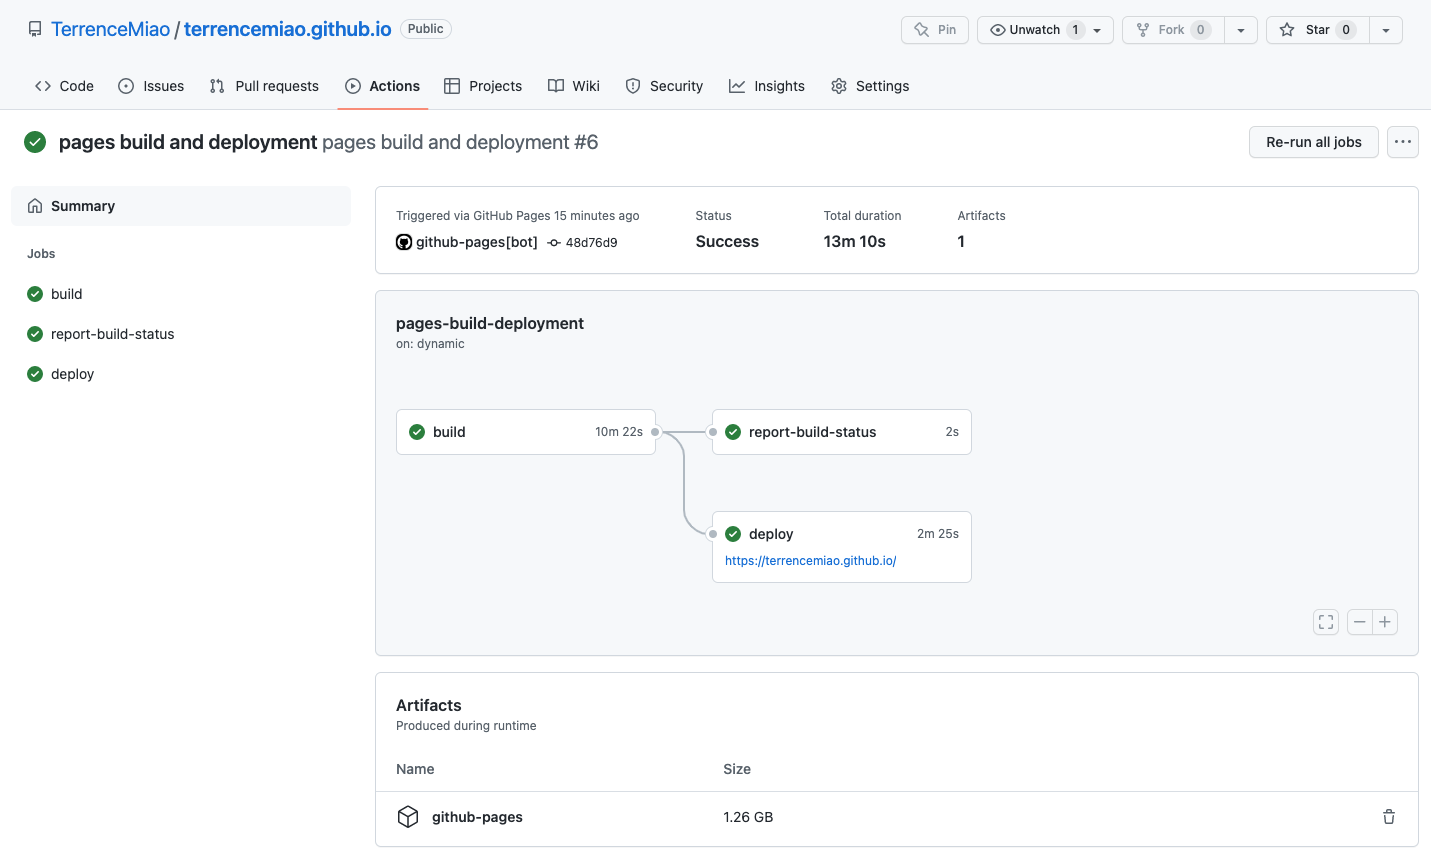
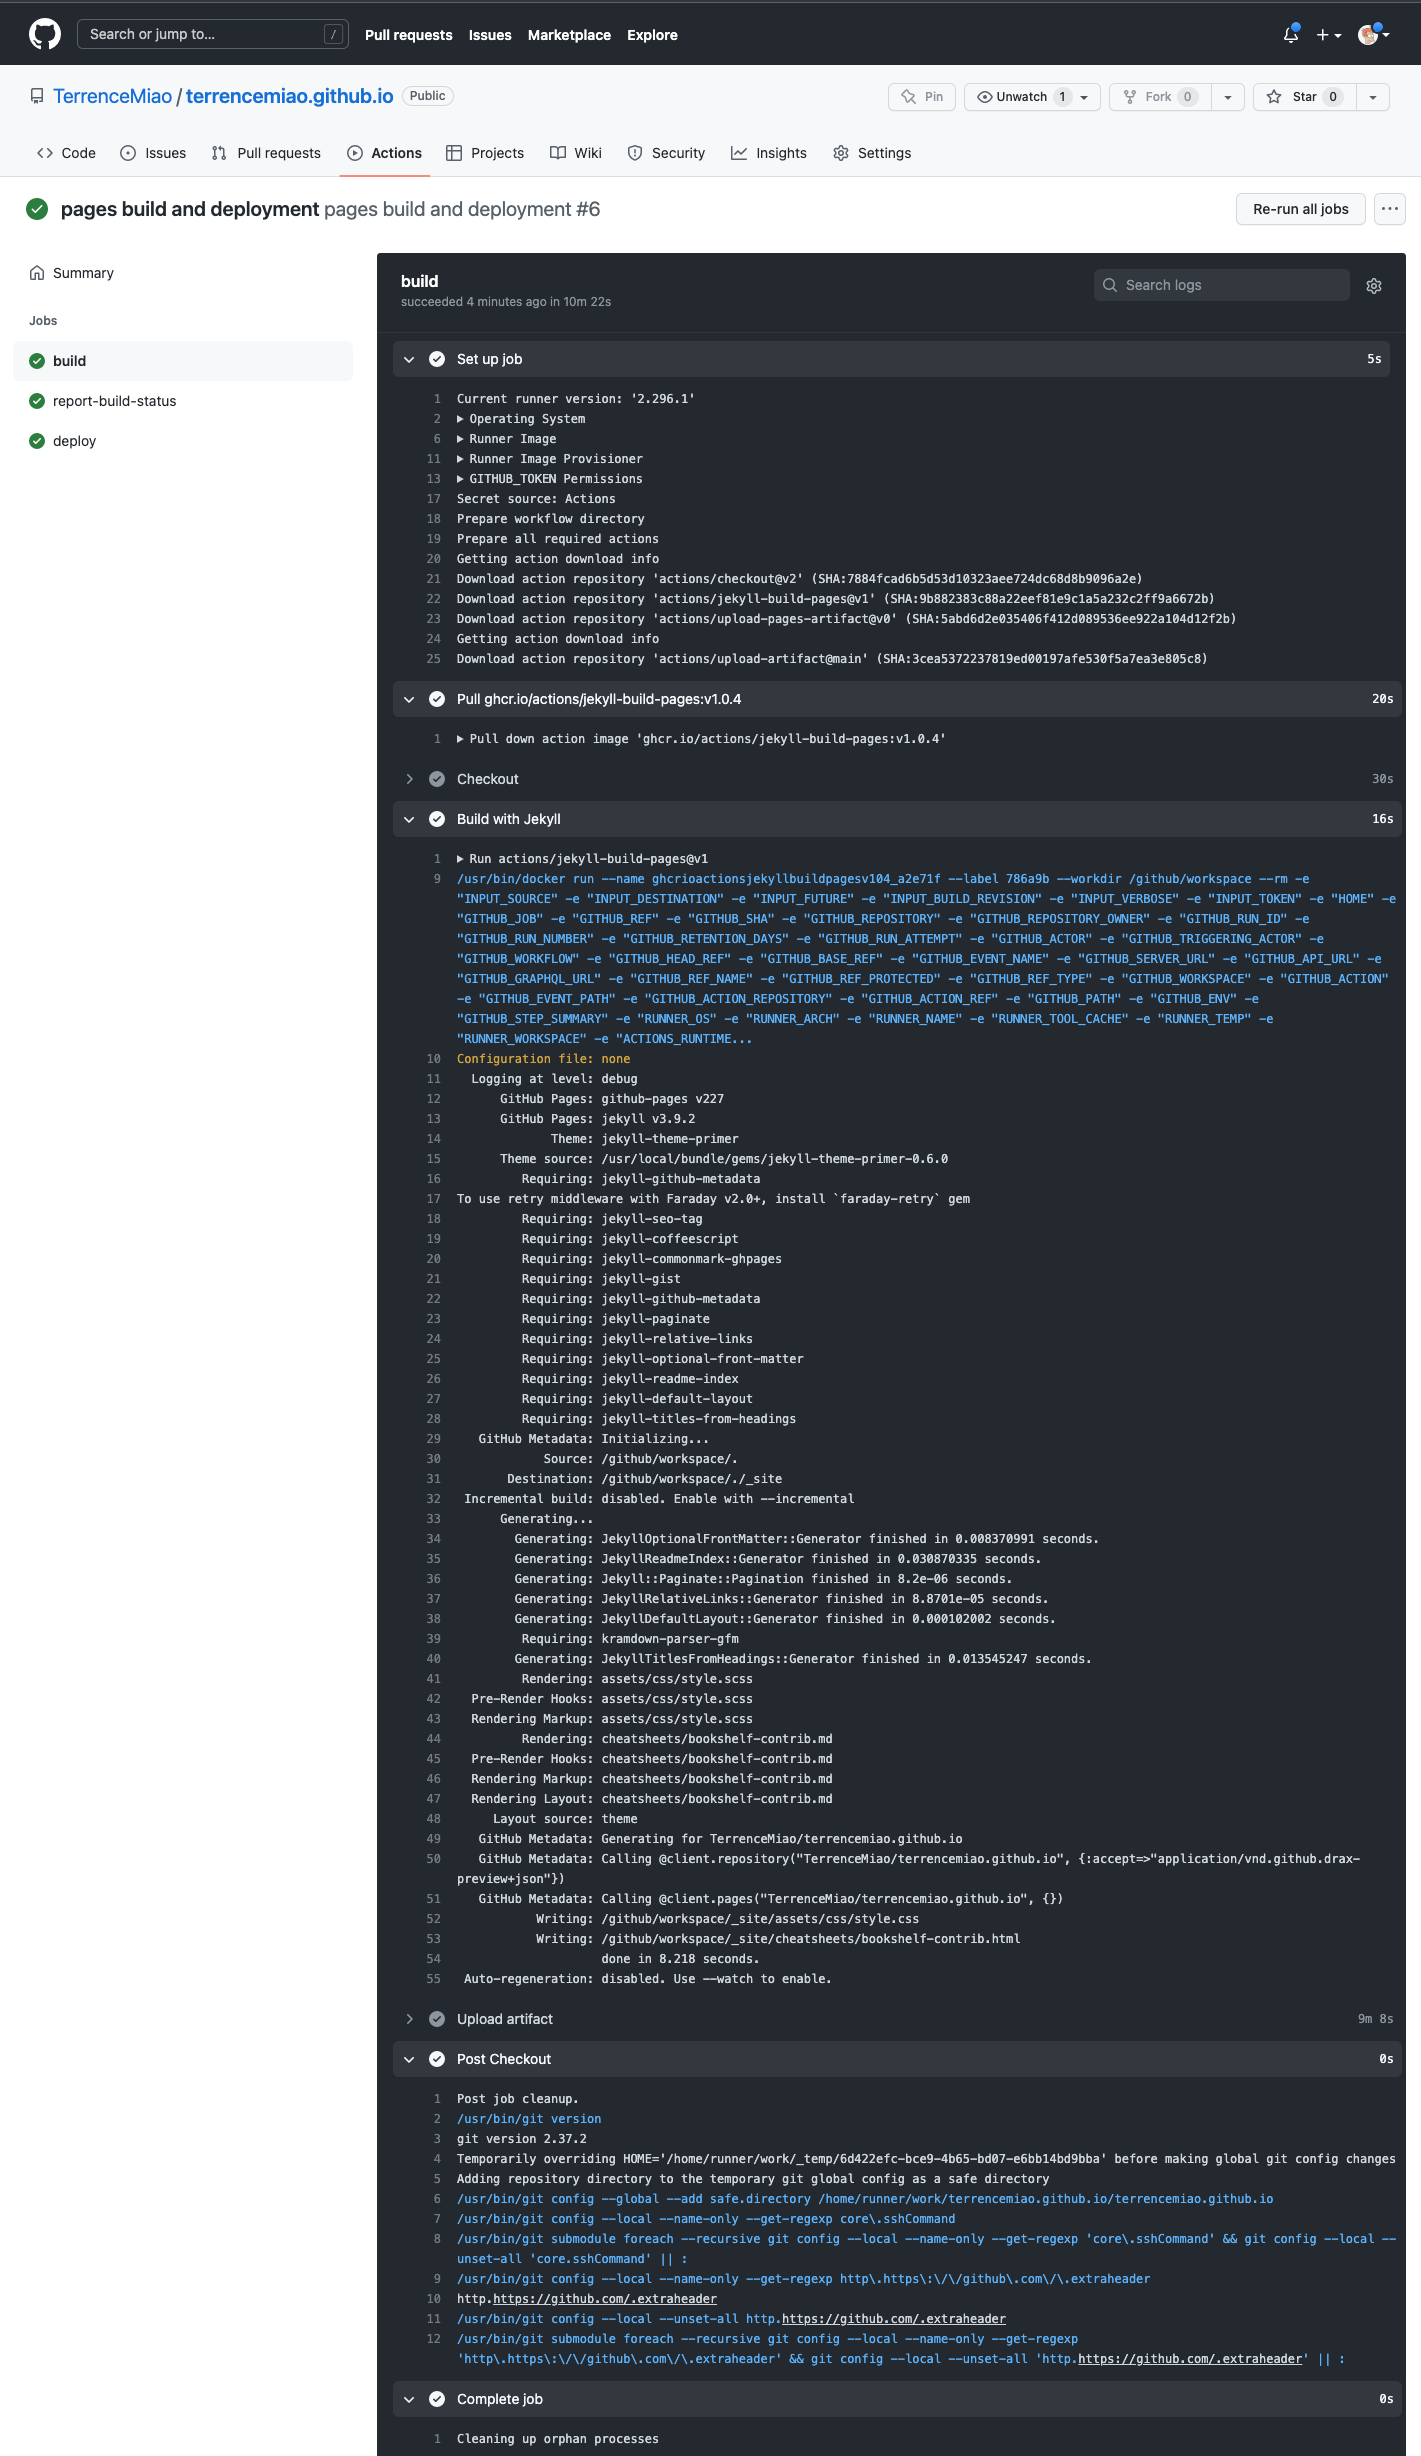
Have you tried GitHub Actions?


First you have Zsh, next install Oh My Zsh https://ohmyz.sh/
1 | sh -c "$(curl -fsSL https://raw.githubusercontent.com/ohmyzsh/ohmyzsh/master/tools/install.sh)" |
Add Powerlevel10k https://github.com/romkatv/powerlevel10k and configure it
1 | git clone --depth=1 https://github.com/romkatv/powerlevel10k.git ${ZSH_CUSTOM:-$HOME/.oh-my-zsh/custom}/themes/powerlevel10k |
Set ZSH_THEME to powerlevel10k in .zshrc
1 | ZSH_THEME="powerlevel10k/powerlevel10k" |
Then run Powerlevel10k configure:
1 | p10k configure |
Add zsh-autosuggestions https://github.com/zsh-users/zsh-autosuggestions
1 | git clone https://github.com/zsh-users/zsh-autosuggestions ${ZSH_CUSTOM:-~/.oh-my-zsh/custom}/plugins/zsh-autosuggestions |
Add zsh-syntax-highlighting https://github.com/zsh-users/zsh-syntax-highlighting
1 | git clone https://github.com/zsh-users/zsh-syntax-highlighting.git ${ZSH_CUSTOM:-~/.oh-my-zsh/custom}/plugins/zsh-syntax-highlighting |
and enable them in .zshrc:
1 | ... |
Install Fig (deprecated) https://fig.io/, an IDE-style autocomplete but for terminal, and configure in .zshrc
1 | ... |
Step by step convert exported JSON data from AWS DynamoDB table into CSV, by using jq.
Export all the data from AWS DynamoDB table at first:
1 | 𝜆 aws --profile production dynamodb scan --table-name tiles > tiles.json |
The exported JSON data looks like:
1 | { |
Extract / transform JSON data:
1 | 𝜆 cat tiles.json | jq '[.Items[] | { id: .id.S, title: .title.S, description: .description.S, status: .status.S, valid_from: .valid_from.S, valid_to: .valid_to.S }]' > tiles-extracted.json |
Convert JSON data into CSV:
1 | 𝜆 cat tiles-extracted.json | jq -r '(.[0] | keys_unsorted) as $keys | $keys, map([.[ $keys[] ]])[] | @csv' > tiles.csv |
In IntelliJ IDEA, you can comment a line, the cursor is moved to the next line automatically. This is a very easy way to comment several lines. However, in VS Code, default behaviour is that the cursor stays on the same line.
To copy the behavior of IntelliJ, go with:
Install macros author by geddski in VS Code.
Edit settings.json and add:
1 | "macros": { |
keybindings.json and add:1 | [ |
A simple, straightforward way export and import AWS DynamoDB table’s data with AWS CLI and a few scripts.
At first, export all the data from AWS DynamoDB table:
1 | 𝜆 aws --profile production dynamodb scan --table-name tile-event > tile-event-export.json |
Convert a list of items/records (DynamoDB JSON) into individual PutRequest JSON with jq.
1 | 𝜆 cat tile-event-export.json | jq '{"Items": [.Items[] | {PutRequest: {Item: .}}]}' > tile-event-import.json |
Transform the data if necessary:
1 | 𝜆 sed 's/tile-images-prod/tile-images-pdev/g' tile-event-import.json > tile-event-import-transformed.json |
Split all requests into 25 requests per file, with jq and awk (Note: There are some restriction with AWS DynamoDB batch-write-item request - The BatchWriteItem operation can contain up to 25 individual PutItem and DeleteItem requests and can write up to 16 MB of data. The maximum size of an individual item is 400 KB.)
1 | 𝜆 cat tile-event-processed.awk |
Import all 22 processed JSON files into DynamoDB table:
1 | for f in tile-event-import-processed-{1..22}.json; do \ |
For all the people painfully read logs on AWS CloudWatch console, saw is your friend.
Get CloudWatch log groups start with paradise-api:
1 | 𝜆 saw groups --profile ap-prod --prefix paradise-api |
Get last 2 hours logs for paradise-api from CloudWatch, with saw:
1 | 𝜆 saw get --profile ap-prod --start -2h paradise-api-CloudFormationLogs-mwwmzgYOtbcB --prefix docker | jq .log | sed 's/\\\n"$//; s/^"//' |